
Motivation
I wanted to organize a workflow centered around coverage at my company and sought to understand precisely what coverage is.
Introduction
We will learn how jest --CollectCoverage --coverageProvider=v8 measures coverage. Starting with jest, we will briefly examine v8 and understand how coverage is measured.
If you already know the theory of compilers (a bit), it will be easier to read.
Coverage?
In software engineering, code coverage is a percentage measure of the degree to which the source code of a program is executed when a particular test suite is run. - Wikipedia
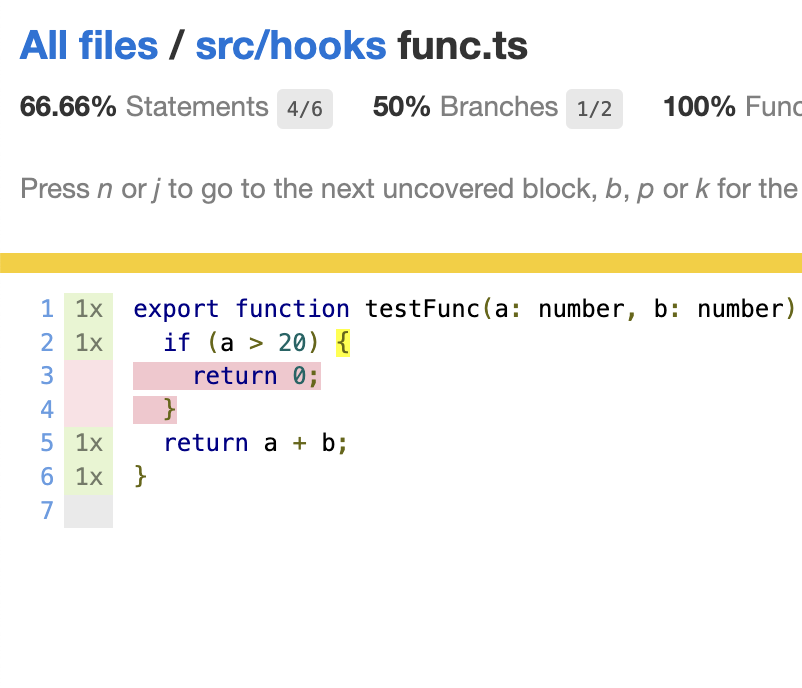
We are testing our code using jest and can measure test coverage through the -CollectCoverage option.
Target function:
export function testFunc(a: number, b: number) {
  if (a > 20) {
    return 0;
  }
  return a + b;
}
Test code:
import { testFunc } from "~/hooks/func";

it('test', ()=> {
  expect(testFunc(10, 20)).toBe(30);
})
We can see the coverage information with uncovered lines.
Coverage in jest
How is this coverage measured? And what it is?
Let’s see with v8.
Jest internally uses collect-v8-coverage package. In the implementation:
async startInstrumenting() {
    this.session.connect();

    await this.postSession('Profiler.enable');

    await this.postSession('Profiler.startPreciseCoverage', { // Start
      callCount: true,
      detailed: true,
    });
  }
As you can see, the // Start line performs the coverage measurement using Profiler.startPreciseCoverage Chrome Devtools Protocol.
This is a command that sends a request to V8 to utilize the coverage measurement feature in V8. You can find more details:
https://chromedevtools.github.io/devtools-protocol/tot/Profiler/
Now we know how to get coverage data with that protocol.
But how is the coverage collected specifically?
Below is an example of calculating the coverage of test function with that protocol.
const { Session } = require("inspector");

const { promisify } = require("util");

global.session = new Session();
const postP = promisify(global.session.post.bind(global.session));

async function main() {
  global.session.connect();
  await postP("Profiler.enable");

  await postP("Profiler.startPreciseCoverage", {
    callCount: true,
    detailed: true,
  });

  function test(a, b) {
    if (a > 20) {
      return 0;
    }
    return a + b;
  }

  let l = 10;
  var v = 20;

  console.log(test(l, v));

  console.log(test(l, v) === 30);

  console.log(test(l + 20, v) !== 20);

  const r = await postP("Profiler.takePreciseCoverage");

  await postP("Profiler.stopPreciseCoverage");
  await postP("Profiler.disable");

  const file = r.result.find((f) => f.url.startsWith("file://"));
  console.log(JSON.stringify(file, null, 4));
}

main();
Executing result of above code on nodejs environment:
{
    "scriptId": "481",
    "url": "file:///Users/seokho/workspace/chromium/playground/v8_test.js",
    "functions": [
        {
            "functionName": "main",
            "ranges": [
                {
                    "startOffset": 182,
                    "endOffset": 777,
                    "count": 1
                }
            ],
            "isBlockCoverage": false
        },
        {
            "functionName": "test",
            "ranges": [
                {
                    "startOffset": 372, // byte offset
                    "endOffset": 454,
                    "count": 1
                },
                {
                    "startOffset": 409,
                    "endOffset": 431,
                    "count": 0
                }
            ],
            "isBlockCoverage": true
        },
        {
            "functionName": "",
            "ranges": [
                {
                    "startOffset": 699,
                    "endOffset": 729,
                    "count": 0
                }
            ],
            "isBlockCoverage": false
        }
    ]
}
We can know the information of coverage including how many time to execute, does it block coverage or not, and the byte offset. We can calculate the point of coverage information in the source code.
Compiler overview
The below sections may require knowledge of the theory of compiler overview. I’ll describe it briefly.
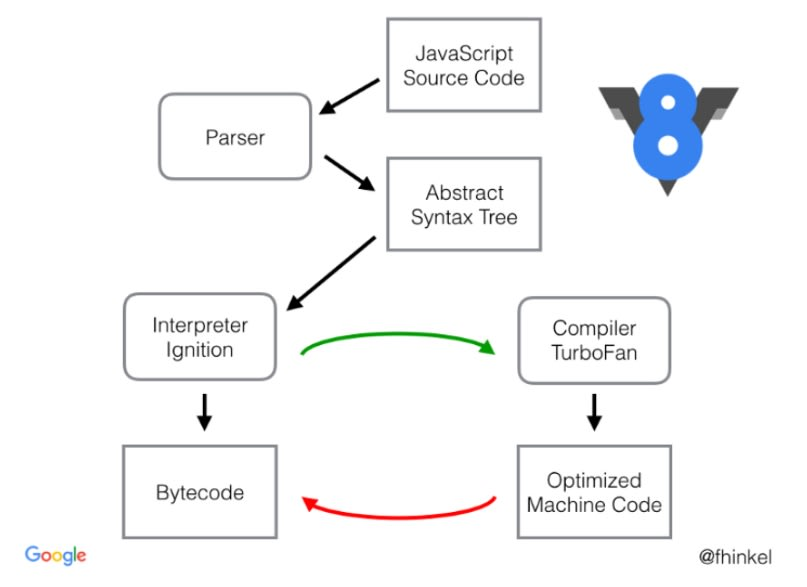
The compiler has multiple pipelines that process the source code to AST and finally target code like x86 Assembly, bytecode, and so on.
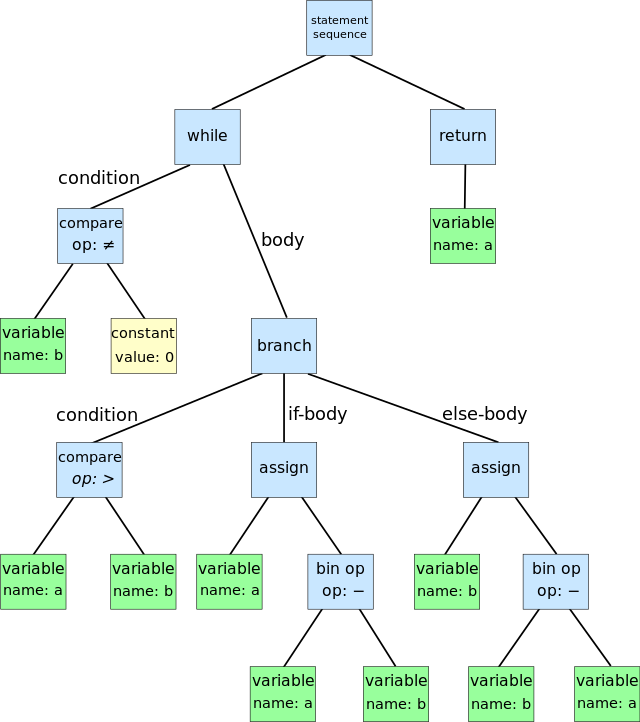
Visualized AST
The pipeline that processes the source code to AST and finally results in IR(Intermediate Representation; v8 turboshaft) is called “compiler frontend” The target codes generator for a given IR is called ‘compiler backend’. The object code is executed on the machine with x86 asm or VM with bytecode.
Compilers make the source code to Tree and then generate IR after that make Object code with that IR.
To summarize, the compiler compiles the code by first creating AST, then converting the tree into an IR, and finally generating target code through the intermediate representation.
How to check coverage in V8
How the coverage is calculated on V8?
V8 supports two ways to collect coverages:
- Best effort
- Not significantly impact execution performance but may lose data due to GC and other things.
- Precise
- Accurate execution counts with detail position and without losing data due to GC, but this may impact execution performance.
Best-effort coverage is a method that utilizes the mechanisms of V8.
Firstly, relies on an element called ‘invoke-counter’. When a function is called through V8’s ignition interpreter, the invoke counter in the feedback vector is incremented each time the function is called.
Secondly, the reuse mechanism involves determining the source range of a function. When collecting coverage, the information of source range associated with invoke-counter is required.
To achieve this, Function.prototype.toString function is used to identify the location of the function. Subsequently, a substring is extracted to internally determine the starting and ending points of the function.
Therefore, the Best Effort coverage measurement is performance-friendly because this relies on reusing byproduct(?) from the code execution.
However, this has limitations because the result is approximate coverage information and can be collected from the GC or other things.
Precise coverage is also called ‘block-level’ coverage, meaning it measures coverage for each individual expression block. For example, this measures coverage for both the “then” block and the “else” block within an “if” statement.
Please note that Best Effort coverage, also use invoke-counter, can be misleading in this context. The invoke-counter in Best effort coverage can only determine source ranges not a block level.
In contrast, Precise coverage measurement in V8 traverses AST and inserts the IncBlockCounter command during bytecode generation for Conditional blocks. Depending on whether this command is executed, we can get detailed coverage data at the block-level.
See with example
In this section, we will see how the concepts described earlier actually work in practice.
Let’s assume we want to measure coverage for the following function:
function test(a, b) {
    if(a > 20) {
      return 0
    }
    return a + b;
  }

  let l = 10
  var v = 20

console.log(test(l,v))

console.log(test(l, v) === 30)

console.log(test(l + 20, v) !== 20)
V8 compiler frontend generates AST from parsing the above code.
Let’s see AST with the following command:
./d8 --print-ast ~/workspace/chromium/playground/test.js
[generating bytecode for function: test]
--- AST ---
FUNC at 13
. KIND 0
. LITERAL ID 1
. SUSPEND COUNT 0
. NAME "test"
. PARAMS
. . VAR (0x158832470) (mode = VAR, assigned = false) "a"
. . VAR (0x1588324f0) (mode = VAR, assigned = false) "b"
. DECLS
. . VARIABLE (0x158832470) (mode = VAR, assigned = false) "a"
. . VARIABLE (0x1588324f0) (mode = VAR, assigned = false) "b"
. IF at 24 // BLOCK
. . CONDITION at 29 // BLOCK
. . . GT at 29 // BLOCK
. . . . VAR PROXY parameter[0] (0x158832470) (mode = VAR, assigned = false) "a"
. . . . LITERAL 20 // BLOCK
. . THEN at -1 // BLOCK
. . . BLOCK at -1 // BLOCK
. . . . RETURN at 41 // BLOCK
. . . . . LITERAL 0 // BLOCK
. RETURN at 57// BLOCK
. . ADD at 66
. . . VAR PROXY parameter[0] (0x158832470) (mode = VAR, assigned = false) "a"
. . . VAR PROXY parameter[1] (0x1588324f0) (mode = VAR, assigned = false) "b"
The noted ‘block’ in the AST will represent the block of the function structure and conditions.
Then, the resulting IR(Intermediate Representation), created through the AST will be passed to the compiler’s backend.
Below is the actual bytecode to run on the VM that the compiler generates by providing the IR from AST:
node --print-bytecode --print-bytecode-filter="test" ~/workspace/chromium/playground/v8_test.js
seokho@Dave ~/workspace/chromium/src/out/Default % node --print-bytecode --print-bytecode-filter="test" ~/workspace/chromium/playground/v8_test.js
[generated bytecode for function: test (0x00a7d39a6811 <SharedFunctionInfo test>)]
Bytecode length: 21
Parameter count 3
Register count 0
Frame size 0
OSR urgency: 0
Bytecode age: 0
  385 E> 0xa7d39b8b88 @    0 : b3 00             IncBlockCounter [0]
  398 S> 0xa7d39b8b8a @    2 : 0d 14             LdaSmi [20]
  403 E> 0xa7d39b8b8c @    4 : 6e 03 00          TestGreaterThan a0, [0]
         0xa7d39b8b8f @    7 : 99 06             JumpIfFalse [6] (0xa7d39b8b95 @ 13)
         0xa7d39b8b91 @    9 : b3 01             IncBlockCounter [1]
  417 S> 0xa7d39b8b93 @   11 : 0c                LdaZero
  425 S> 0xa7d39b8b94 @   12 : a9                Return
         0xa7d39b8b95 @   13 : b3 02             IncBlockCounter [2]
  437 S> 0xa7d39b8b97 @   15 : 0b 04             Ldar a1
  446 E> 0xa7d39b8b99 @   17 : 39 03 01          Add a0, [1]
  450 S> 0xa7d39b8b9c @   20 : a9                Return
Constant pool (size = 0)
Handler Table (size = 0)
Source Position Table (size = 19)
0x00a7d39b8ba1 <ByteArray[19]
We can finally see IncBlockCounter command has been added to the blocks.
IncBlockCounter(slot) command increments the invoke-counter for the corresponding block slot.
This information, accessed as a result through the devtools protocol, is what constitutes the coverage data mentioned in the first section.
References
https://v8.dev/blog/javascript-code-coverage
https://chromedevtools.github.io/devtools-protocol/tot/Profiler/#method-startPreciseCoverage
https://docs.google.com/document/d/1wCydi2HEZRF0skDeLb6CH0abZnTyVo5Vz5u-jhwi7es/mobilebasic